First-order diffraction in different cases is visualized in this page. The geometry has been computed with DIVA software, and with P. Svensson's diffraction toolbox and visualized with MATLAB software.

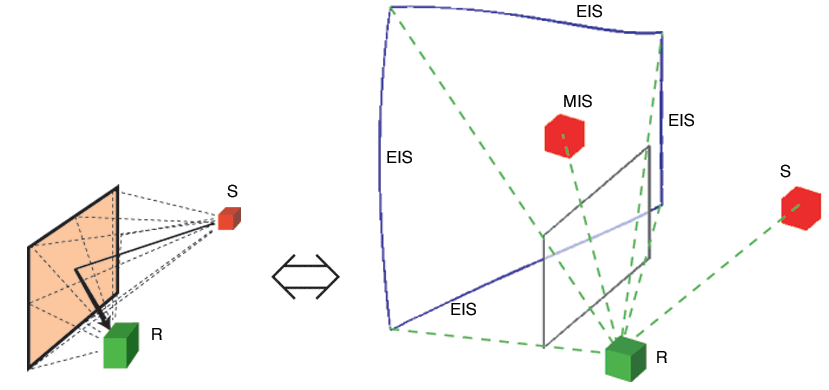
The acoustic effect of a wall can be visualized with image sources. A wall with four edges produces one mirror image source (MIS) that is presented as a red cube, and four edge image sources (EIS) that are presented as blue curved lines. The color and thickness of the line respects the magnitude of emanation.

The colorscale for all figures in this page.

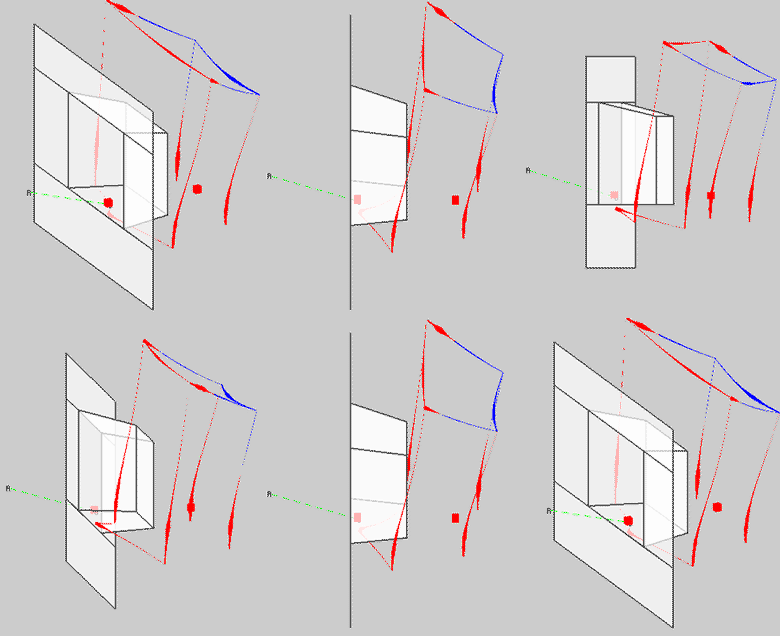
The first-order image sources occurring in a stagehouse. There is no room, only a wall that has a stage. Source and the only MIS are presented as red cubes. There are nine EIS:s that are visualized as curved lines. The thickness and color is dependent on amplitude of sound emanation from each point.

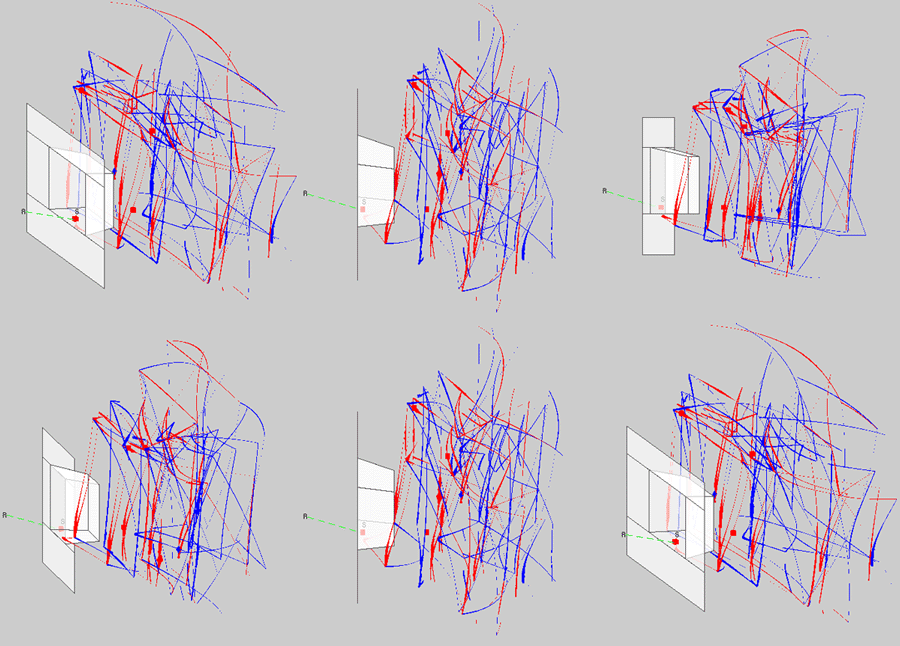
All image sources in a stagehouse including maximally one diffraction and maximally three reflections. The order of image sources is, however, maximally three.

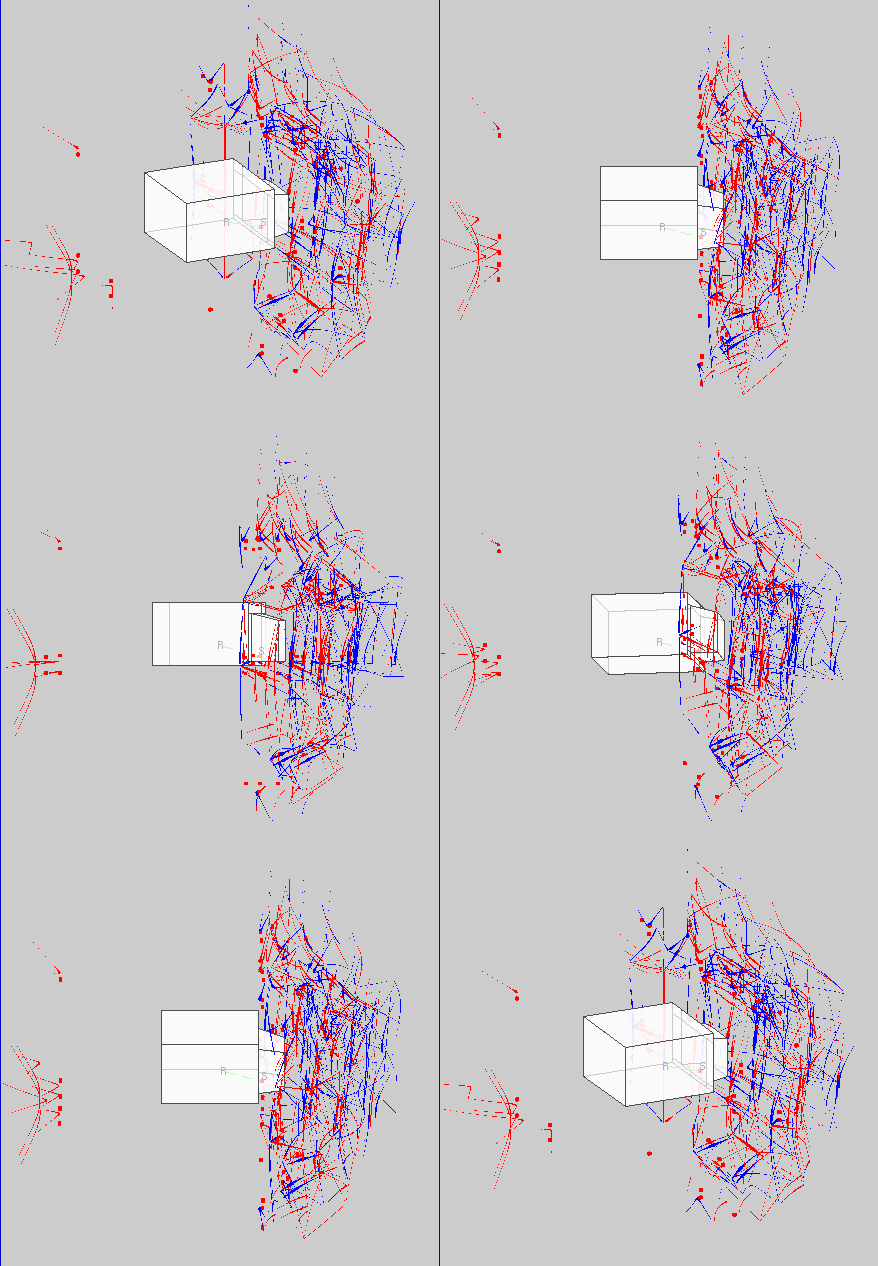
Third-order image sources in a room with a stagehouse that are closer than 60 meters from the listener. The number of image sources increases dramatically due to increased reflections from walls of room.
 This URL: http://www.acoustics.hut.fi/